
Why Some Coins Pump When Bitcoin Dominates: A Measured Look
We measured 150 liquid Bybit perps against our production market-regime timeline. The coins that outperform when everything bleeds are not a secret sector — they are idiosyncratic-flow coins, and the data shows exactly how they behave in each regime.
Summary
Most liquid altcoins track Bitcoin: across the 150 most liquid Bybit perps, the median 90-day correlation with BTC is about 0.39. A small tail does not — HOME sits at the 4th percentile of that distribution, DEXE at the 6th, AKE at the 8th — and those are the coins that appear to "pump against the trend" when Bitcoin dominates and the median alt bleeds.
The surprise in the data: those coins are not a sector. Their pairwise correlations with each other are essentially zero. Each one moves on its own flow — fresh listings, low float, points programs, standalone narratives — and idiosyncratic flow mechanically looks independent, and occasionally inverse, next to a market that mostly moves together.
The pattern people notice
In stretches where money rotates into Bitcoin and the average altcoin drifts down, a handful of coins run anyway — sometimes violently. Watching a screen full of red with three green outliers, it is natural to conclude those coins are "inversely correlated" with Bitcoin, and to look for the common thread between them.
We measured it instead. The test set was the 150 most liquid Bybit USDT perpetuals over 90 days of daily returns, plus hourly returns joined against our production regime timeline — the same regime labels that gate our own signal routing, recorded as they were accepted, not reconstructed after the fact.
Most alts track Bitcoin. A measurable tail does not
The median liquid alt has a 90-day daily-return correlation with BTC of roughly 0.39; the 90th percentile sits near 0.70. That is the ordinary state of this market: one macro trade expressed through hundreds of tickers.
The interesting coins sit in the other tail. In our study window HOME measured at -0.12 (4th percentile of the whole universe), DEXE at -0.04 (6th), AKE at 0.01 (8th). Statistically these coins carry almost no Bitcoin beta at all — they neither rally with it nor bleed with it.
They are not a sector
The obvious hypothesis is a shared factor: some anti-Bitcoin rotation, one narrative bid lifting the same basket. The data rejects it cleanly. Pairwise hourly correlations among the six coins we were asked about were approximately zero — the highest pair reached 0.26, the rest were indistinguishable from noise.
If these coins were one trade, they would correlate with each other. They do not. Each is an idiosyncratic-flow coin: recently listed (four of the six arrived on Bybit perps only in mid or late 2025), low float, with its own points program, unlock schedule, or narrative moment. When a coin is priced by its own flow rather than by market beta, it mechanically looks independent — and next to a bleeding market, independence photographs as inverse correlation.
What the regimes actually paid
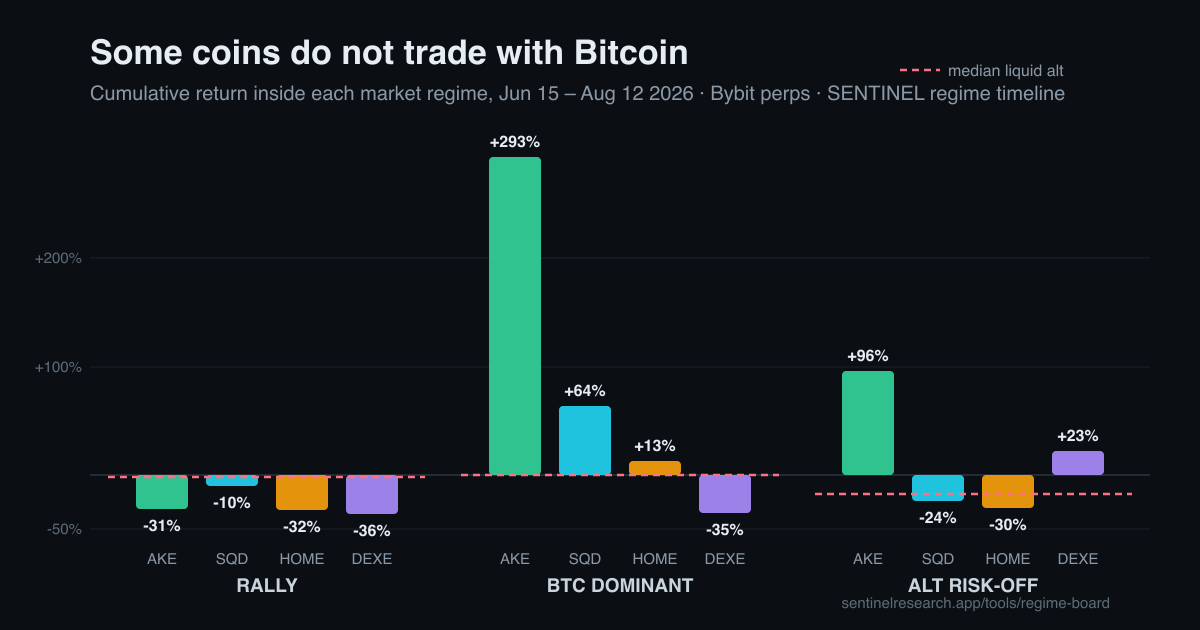
Conditioning on our regime timeline makes the behaviour legible. In the BTC-dominant regime — 323 hours of it in the window — the median liquid alt was flat and Bitcoin itself was slightly down, while AKE returned +293%, SQD +64% and HOME +13% cumulatively. In alt risk-off, where the median alt lost 17%, DEXE made +23% and AKE +96%.
The same coins were not safe havens in good times. During RALLY hours, when Bitcoin ground higher and beta was the winning trade, AKE lost 31%, HOME 33% and DEXE 36%. Independence cuts both ways: a coin that does not follow the market up will not be carried by it either, and it falls alone when its own flow turns.
- BTC_DOMINANT (323h): median alt -0.3% · AKE +293% · SQD +64% · HOME +13%
- ALT_RISK_OFF (384h): median alt -17.4% · AKE +96% · DEXE +23%
- RALLY (504h): median alt -1.6% · AKE -31% · HOME -33% · DEXE -36%
Read it honestly
Three caveats belong next to those numbers. First, the window is one 58-day market phase; regimes with too few observed hours (alt risk-on, crash) are excluded rather than estimated. Second, there is attention bias in any list of coins someone noticed because they went up — one of the six we tested underperformed in almost every regime, which is exactly what you would expect if the class is "coins that move on their own flow" rather than "coins that go up when Bitcoin dominates". Third, none of this is predictive: a leaderboard of what happened inside a regime is context for the next trade, not a promise about it.
That framing is why we publish the surface with hours-observed printed on every row, minimum-observation gates before anything ranks, and the measurement window stated in full.
See it live
The Regime Board runs this measurement continuously against the live regime: the current label our routing actually runs on, every liquid perp ranked by how it has performed inside that regime, a correlation-percentile tag that separates the independent coins from the beta trades, and each coin's full regime profile one click deep.
It is free, it carries no signals, and the honest-reading rules are pinned to the page. If the market regime changes, the board changes with it.
Follow-up, August 30: we tested the entire universe, and the leaderboard rotates
After this post ran, we extended the question it raises to its logical end: not 150 coins over one phase, but every Bybit USDT perpetual with full coverage of our regime window — 457 of them across 258 labelled days — asked whether any coin carries a regime signature that persists out of sample. The answer is no. Zero coins survive multiple-comparison correction with a positive regime edge, a coin's edge in the first half of the window has no correlation with its edge in the second (the top ten by first-half edge went on to underperform the universe), and deliberately misaligned regime labels produce more convincing "regime specialists" than the real labels do. The full study, its scripts and its audit trail are in our research record.
This post's own measurements replicate in the larger dataset — HOME's published −33% inside RALLY re-measures at −32.8% on the same days — so nothing above is retracted. But one exhibit from the study is worth sitting with, because it shows why the closing caveat was load-bearing. Across the 19 RALLY days of this post's window, HOME returned −32.8%. Across all 59 RALLY days of the full study window, the same coin returned +182.3% — simultaneously one of this page's RALLY losers and the wider study's second-ranked "RALLY specialist", from window choice alone. A regime leaderboard is a photograph of a rotation, not a property of the coins on it.
One more thing, in the spirit of the receipts this site runs on: the study went through three revisions and an independent internal audit, and the audit downgraded one of the study's own headline claims — a market-wide regime spread that looked cleanly significant until the test was charged for the number of comparisons that produced it. We published the downgrade next to the claim. When we say "none of this is predictive" at the bottom of a leaderboard, that sentence has now been tested at universe scale, on our own findings first.
Common questions
Are there altcoins that are inversely correlated with Bitcoin?
Persistently inverse coins are rare. What the data shows instead is a tail of coins with near-zero Bitcoin correlation — in our study HOME, DEXE and AKE sat in the bottom decile of a 150-coin universe. They move on their own flow, which can look inverse during stretches when the broad market falls and their own flow is positive.
Why do some coins pump when Bitcoin dominance rises?
In BTC-dominant stretches the median alt goes nowhere, so any coin with a strong idiosyncratic bid — a new listing, a points program, a standalone narrative — stands out sharply against the flat field. In our window the effect was large: individual coins returned +64% to +293% cumulatively while the median liquid alt was flat.
Can I trade the regime leaderboard directly?
We deliberately do not present it as a signal. The leaderboard describes what happened inside a regime over a stated window, behind minimum-observation gates. Past regime behaviour is context; the same independence that let a coin rally against a bleeding market also lets it crash alone.
Try it live
How this was produced
Every claim was verified against the live SENTINEL codebase and the current product surfaces. This is educational product documentation, not financial advice.